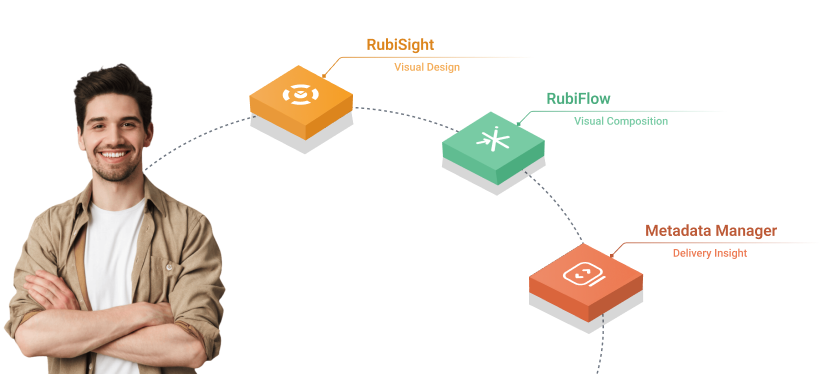
RubiSight
See your data better!
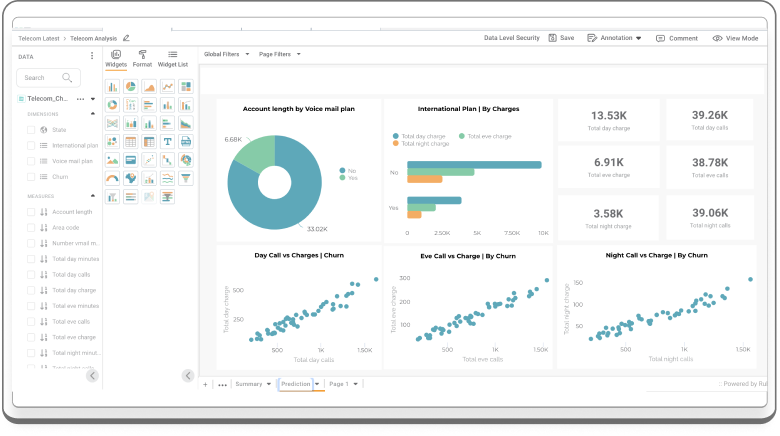
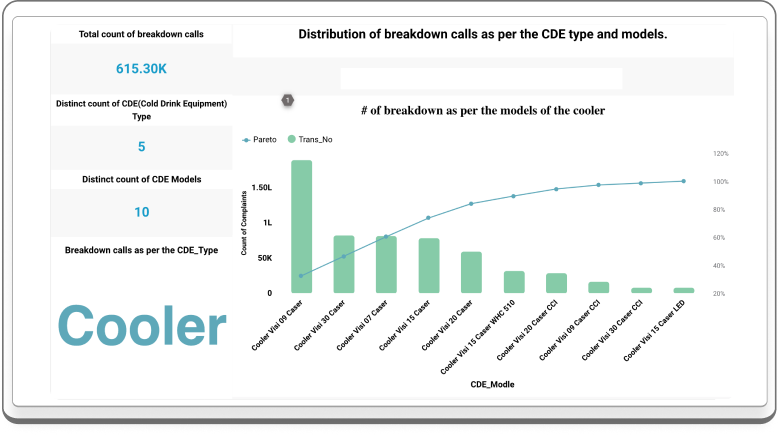
RubiSight is a DATA STORYTELLER, with a drag-and-drop interface for creating visually appealing interactive dashboards advance data exploration capabilities for a better understanding of hidden insights.
- Drag & Drop Interface
- Data Preparation
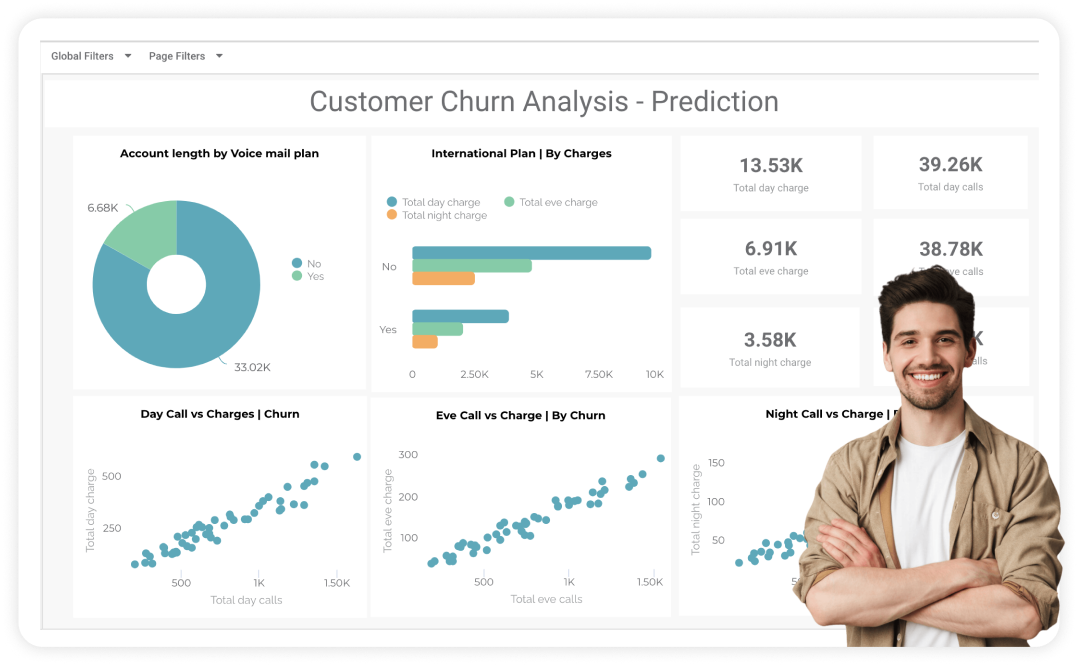
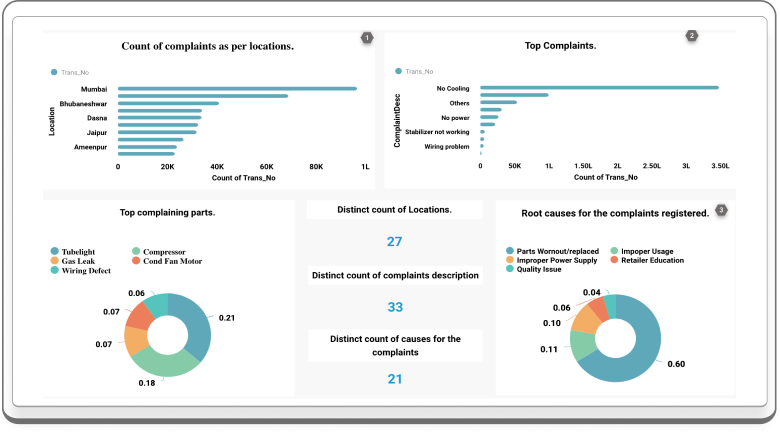
- Visual Analysis
- Dynamic Dashboards
- What-if-Analysis
- SaaS & PasS
- Pre-built Widgets
- Embedded Analytics
- Security & Governance
- Geo visualisation Data Alerts
- Pre-built Widgets
- Automation & Scheduling
What’s under the hood?
Unifying Data For Dynamic Dashboards
Seamless Connectivity, Comprehensive Views, and Real-time Streamlining
- Integrate diverse data seamlessly
- Allow effortless, comprehensive dashboard views
- Enhance data accessibility and consolidation
- Facilitate holistic insights through unified dashboards
- Streamline real-time updates for dynamic dashboard views
Dynamic Data Insights
Explore, Customize, Collaborate: Unleash the Power of Advanced Visualization
- Explore interactively with tooltips, drill-downs, and filters.
- Customize using color, fonts, and styling options.
- Enable real-time collaboration, sharing, and exporting.
- Include diverse advanced chart types.
- Create data-driven stories with annotations and narratives.
Scheduling Simplicity for Dynamic Insights
Timely Insights, Seamless Decision-making, Customized Scheduling
- Scheduled automation and timely insights
- Eliminate manual effort with automated report generation
- Enhance decision-making with up-to-date information
- Customize schedules to align with specific business needs
- Optimize report generation frequency for flexibility
Why RubiSight?
Rubisight helps business users and analysts can connect to any data source and build data monitoring, analysis, and reporting applications without any coding efforts.

Begin your Journey Today
As a Data Visualiser

Hear From Our Clients
Hear from our customers to learn what makes Rubiscape the right choice for them, & why we're the right partner for your business for Data Visualization.
LEARN
Become Data Visualizer
Unlock the power of Visual Storytelling with Rubiscape’s Data Visualization course